![]()
![]()
Consumer Demand and Retail Sales
By Kayla Campos on August 19, 2021
What We Have Learned from Retail EarningsThe U.S. consumer is in focus this week as a large volume of retail companies report Q2 earnings. During the pandemic, companies were pressed to find solutions for an expedited shift in consumer shopping habits favoring e-commerce solutions. With the reopening, analysts are looking for new trends and working to understand which companies have an advantage in their omnichannel sales strategy of online, in-store, and curbside pickup that meet consumer preferences. The omnichannel sales strategy and data-driven technology investments have been a focus for retail companies looking to adapt to the pandemic and add value to the customer shopping experience. In addition to shopping preferences, there is focus on what product types drove sales, against a unique y/y comps backdrop. There is continued focus on how companies managed supply chain constraints and inflationary pressures to meet demand and fill inventories. We’ve focused a great deal on supply chain constraints; reports from retail companies offer the most visible lens into how they are managing operations during this unprecedented period. Depleted inventory levels have been reported through ISM Manufacturing data as well as anecdotally, with executives relaying struggles to maintain supply due to raw materials shortages. During earnings calls, management teams are discussing how they’ve adapted their operations to deal with supply chain bottlenecks, whether higher costs were passed down to the consumer (and whether that was enough to maintain margins), and expectations for the second half. Simply put, those executives that planned for supply issues months ago have implemented appropriate actions in pricing and cost cutting to ensure the inflation offset. |
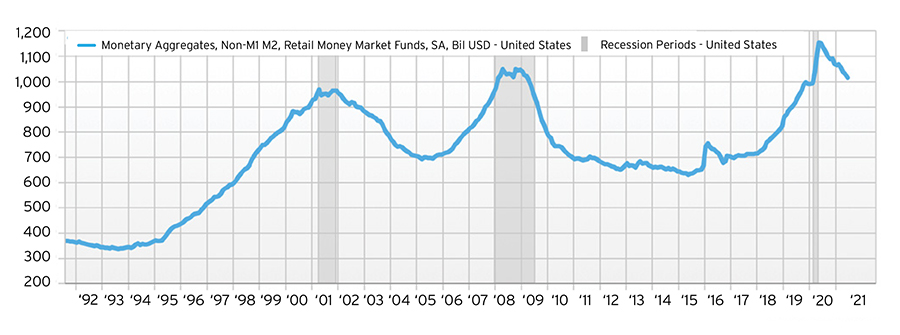
The Consumer: The Driver of GDPConsumer spending represents nearly 70% of GDP and retail is a critical part of the economy. Consumer spending rose a strong +2.8% in the second quarter and personal expenditures rose +11.8%. Savings remains high by historical standards and now stands at 10.9% – vs 5%, which is the typical rate. We see a lot of pent-up demand which will continue to drive the above trend growth. In addition to pent-up demand from the consumer, there is $4.5T in money market funds in the system. This is a stark contrast to the $2.8T historical figure. We believe some of this could be a positive potential tailwind for equity markets going forward. |
Chart 1: Retail Money Market Fund Levels (representing cash savings)1
|
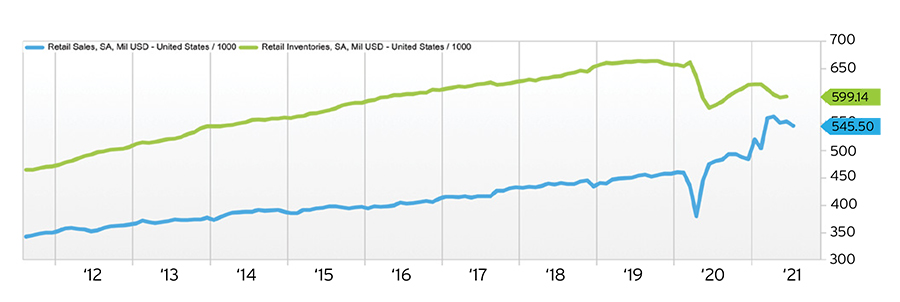
July Retail Sales Data Disappoints – and Presents a Buying OpportunityThe headline retail sales figure fell 1.1% in July compared to June, due to higher inflation concerns and Deltavariant unknowns; however, June figures were revised higher. And on a year over year basis, US retail sales rose 15.78% and are still up 18.9% vs 2019 levels. Quite impressive – and a much needed perspective. The consumer remains strong and resilient especially as job growth improves; JOLTs are now 10.1m. The below chart provides additional perspective on the current situation. Elevated retail sales due to pent-up demand (which continues to be elevated even if it is normalizing) is at a narrow margin to historical inventory levels. We expect that as supply chain constraints get worked out, inventory levels will rise, sales will normalize, and the trend seen in the chart prior to the pandemic continues. The question then becomes, when will supply chain constraints get worked out and at what rate will sales fall and inventories rise? The growing labor force will help supply chains, but continued port closures create more bottlenecks – a two steps forward, one step back dynamic. All signs point to an extended recovery, which bodes well for our barbell strategies that overweight cyclicals. COVID fears continue, cash remains on the sideline, the labor force is growing, supply chains continue to experience bottlenecks and costs remain elevated, which means prices remain elevated and inflationary pressures remain. |
Chart 2: Retail Sales vs Retail Inventories2
|
Retail Earnings Takeaways (So Far…)Retail earnings have been terrific – but the expectations were quite high. Most so far have handled the supply constraints and margins remain resilient. Housing demand is clearly one of the highlights – on TJX’s conference call the CEO highlighted “our housing sales are phenomenal.” HD and LOW also comfortably beat same-store sales against high expectations, but the demand side is real.
1 Source: FactSet
|
Subscribe to Our Newsletter!
Lyon Wealth Management is a group comprised of investment professionals registered with Hightower Advisors, LLC, an SEC registered investment adviser. Some investment professionals may also be registered with Hightower Securities, LLC (member FINRA and SIPC). Advisory services are offered through Hightower Advisors, LLC. Securities are offered through Hightower Securities, LLC.
This is not an offer to buy or sell securities, nor should anything contained herein be construed as a recommendation or advice of any kind. Consult with an appropriately credentialed professional before making any financial, investment, tax or legal decision. No investment process is free of risk, and there is no guarantee that any investment process or investment opportunities will be profitable or suitable for all investors. Past performance is neither indicative nor a guarantee of future results. You cannot invest directly in an index.
These materials were created for informational purposes only; the opinions and positions stated are those of the author(s) and are not necessarily the official opinion or position of Hightower Advisors, LLC or its affiliates (“Hightower”). Any examples used are for illustrative purposes only and based on generic assumptions. All data or other information referenced is from sources believed to be reliable but not independently verified. Information provided is as of the date referenced and is subject to change without notice. Hightower assumes no liability for any action made or taken in reliance on or relating in any way to this information. Hightower makes no representations or warranties, express or implied, as to the accuracy or completeness of the information, for statements or errors or omissions, or results obtained from the use of this information. References to any person, organization, or the inclusion of external hyperlinks does not constitute endorsement (or guarantee of accuracy or safety) by Hightower of any such person, organization or linked website or the information, products or services contained therein.
Click here for definitions of and disclosures specific to commonly used terms.
1550 Tiburon Blvd
Suite B Up #6
Tiburon, CA 94920
(415) 702-1622
Legal & Privacy
Web Accessibility Policy
Form Client Relationship Summary ("Form CRS") is a brief summary of the brokerage and advisor services we offer.
HTA Client Relationship Summary
HTS Client Relationship Summary
Hightower Advisors, LLC is a SEC registered investment adviser. Registration as an investment adviser does not imply a certain level of skill or training. Some investment professionals may also be registered with Hightower Securities, LLC and offer securities through Hightower Securities, LLC, member FINRA/SIPC. You can check the background of our firm and investment professionals on brokercheck.finra.org. Unless otherwise indicated relative to a specific award or ranking, Hightower Advisors, LLC does not pay a fee to be considered for any ranking or recognition, but may have paid to publicize rankings obtained and disseminated prior to 11.4.2022. All awards / rankings / ratings obtained and distributed on or after 11.4.2022 will be accompanied by specific disclosure as applicable.
© 2026 Hightower Advisors. All Rights Reserved.