![]()
![]()
Uncovering Interest Rate Sensitive Sectors: Housing and Autos
By Lyon Wealth Management on February 9, 2023
Shifting Interest Rates Impact Housing and Auto Markets More Rapidly
The APR on new financed vehicles rose to 6.5% in 4Q22, up from 4.1% a year prior.1 Similarly, mortgage rates peaked in November, reaching the highest level since 2002. In addition to higher lending rates, price inflation has contributed to higher costs for potential buyers. But the winds of change might be blowing.
The CPI annual inflation measure for used vehicles peaked in 2021 at +42% y/y, while new vehicles inflation peaked more recently last April at +13.2% y/y. Similarly, the peak annual increase in home prices, according to the S&P/Case-Shiller Home Price Index, was last April at +19.7% y/y. Amid recent and ongoing supply chain challenges, new vehicles were difficult to come by. This placed upward pressure on the price for used vehicles throughout 2021, and now that new vehicles have become more readily available, used car prices are -8.8% y/y (still +38% vs. pre-pandemic level).
Chart 1: Annual Inflation Retreating as Interest Rates Soar2
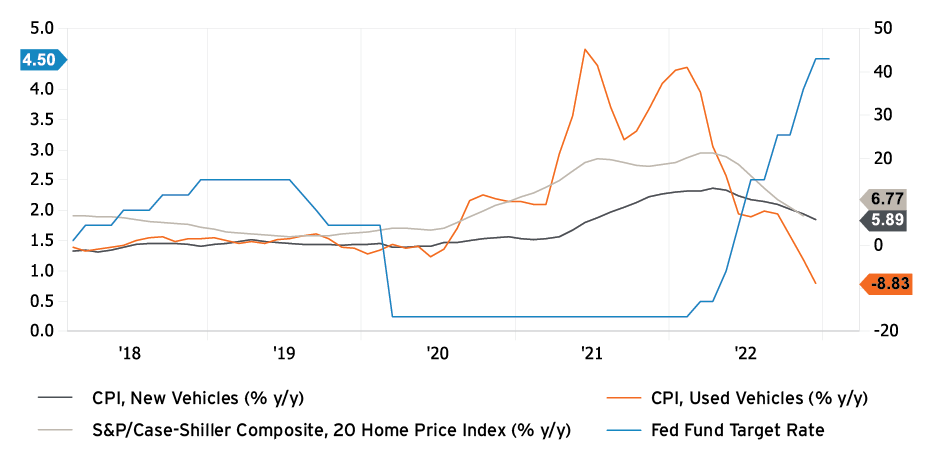
The disinflation across the goods economy since last summer, including both the auto and housing markets, is a direct, inverse relationship with the Fed’s restrictive policy actions. But there’s much more to the story; while restrictive monetary policy has a visibly direct impact, a more complex supply/demand dynamic remains under the surface, which will ultimately impact (and help measure) how the U.S. economy moves forward.
Easing Cost Pressures Supporting Economic Activity
Higher interest rates have clearly done their part. In contrast to the Fed’s continued policy actions, which have made monetary access more restrictive, mortgage rates have actually fallen materially since November.
A 30-year fixed mortgage rate is now 6.47%, compared to its November peak 7.35%. Coupled with declining prices and healthy consumer balance sheets, housing has become more affordable in recent months. Mortgage rates remain much higher than a year ago, when they were just beginning to rise, and annual rates were priced around 4%. But, in tandem, unemployment rate has hovered around all-time lows and personal income is up +4.7% y/y.
Supporting elevated prices, consumer balance sheets are healthy and vacancy rates/inventory are very low due to supply deficits across both the housing and auto sectors. While annual inflation has retreated, prices for homes and new vehicles remain elevated (+6.8% y/y and +5.9% y/y, respectively).
Overall, the pace of inflation is certainly easing, and this supports the consumer, but resilient demand and persistent shortages are keeping prices stable. We’re focusing on these markets to provide insights into the broader economy and consumer health – where do things go from here?
Housing Market Has Considerable Multiplier Effects for the Broader Economy
Home prices fell for the fifth-straight month in November, according to the S&P/Case-Shiller index report. Despite this recent downtrend, which is helpful for the potential homebuyer and has led to increased activity, there remains a supply deficit. The U.S. is short an estimated 5.4 million homes due to 13 years of underproduction. The home shortage is up from an estimated 4 million in 2019. As prices and mortgage rates retreat, housing activity has rebounded.
Chart 2: Leading Indicators Show Inventory Deficit Continuing and Increased Buying Activity3
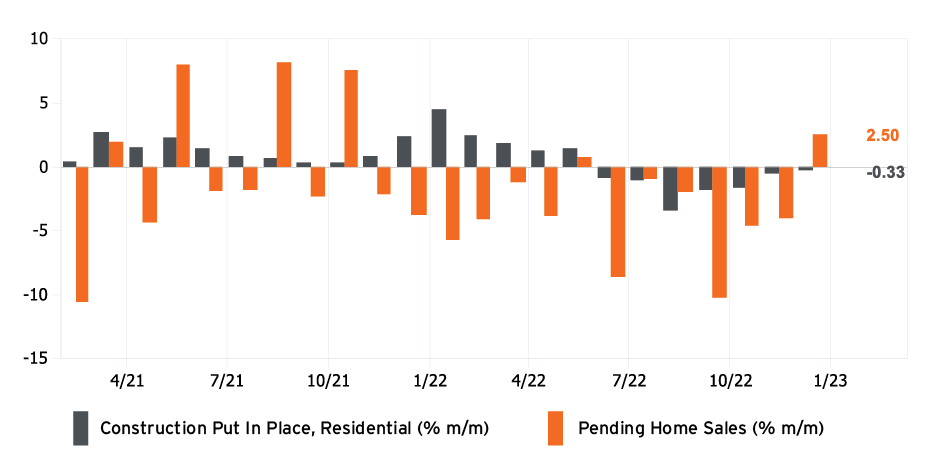
It’s possible we’ve experienced a trough in housing market activity, which represents larger opportunities for the broader economy. Housing market’s contribution to GDP is roughly 15-18% – broken down into residential construction (3-5%) and consumption spending on housing services, which includes rents and utilities (12-13%). Spending also expands to furniture, appliances, gardening and, of course, autos.
Leading indicators underscore a persistent shortage, with housing starts down -22% y/y and permits down -30% y/y. Shortages persist, activity has showed signs of rebounding and mortgage costs are improving. For these reasons, we don’t anticipate a major correction in the housing market.
Auto Industry Offers Insights Into Consumer Health, Discretionary Price Elasticity and Supply Chains
Shortages also persist within the auto industry, as inventories remain at about half of pre-pandemic levels and tight supply conditions are expected to last through the year. Elevated costs for new vehicles – higher prices and higher leasing rates – are continuing to price some potential buyers out of the market.
The average price paid for a new car reached a record $47,362 in December. Meanwhile, borrowers behind on their payments by more than 90 days remains very low, representing just 1.84% of all outstanding auto loans.4 A combination of higher interest rates and supply-driven higher prices has tested consumer affordability, and automakers and dealerships alike seem to be recognizing a tipping point.
Selling prices are expected to fall this year as automakers boost consumer incentives. Ford (F) said it expects its average selling price to fall -5% this year. Strong selling prices helped General Motors (GM) post record pre-tax profits last year, despite lower vehicle sales. Overall, 2022 U.S. auto sales fell to 13.7 million vehicles – their lowest levels in more than a decade. Lower prices will support better volumes but will likely take a bite out of profit margins.
Overcoming the past three years of supply challenges, many car manufacturers are predicting sales volume to rise to around 15 million this year as constraints ease, still far below pre-pandemic levels (17 million). The amount of new cars available for sale is rising, as customers put off car purchases and cancel reservations that were made when interest rates were lower.5
Disinflationary trends will continue to support the consumer and auto sales will offer unique insights into the consumer’s demand elasticity for discretionary goods.
Subscribe to Our Newsletter!
Lyon Wealth Management is a group comprised of investment professionals registered with Hightower Advisors, LLC, an SEC registered investment adviser. Some investment professionals may also be registered with Hightower Securities, LLC (member FINRA and SIPC). Advisory services are offered through Hightower Advisors, LLC. Securities are offered through Hightower Securities, LLC.
This is not an offer to buy or sell securities, nor should anything contained herein be construed as a recommendation or advice of any kind. Consult with an appropriately credentialed professional before making any financial, investment, tax or legal decision. No investment process is free of risk, and there is no guarantee that any investment process or investment opportunities will be profitable or suitable for all investors. Past performance is neither indicative nor a guarantee of future results. You cannot invest directly in an index.
These materials were created for informational purposes only; the opinions and positions stated are those of the author(s) and are not necessarily the official opinion or position of Hightower Advisors, LLC or its affiliates (“Hightower”). Any examples used are for illustrative purposes only and based on generic assumptions. All data or other information referenced is from sources believed to be reliable but not independently verified. Information provided is as of the date referenced and is subject to change without notice. Hightower assumes no liability for any action made or taken in reliance on or relating in any way to this information. Hightower makes no representations or warranties, express or implied, as to the accuracy or completeness of the information, for statements or errors or omissions, or results obtained from the use of this information. References to any person, organization, or the inclusion of external hyperlinks does not constitute endorsement (or guarantee of accuracy or safety) by Hightower of any such person, organization or linked website or the information, products or services contained therein.
Click here for definitions of and disclosures specific to commonly used terms.
1550 Tiburon Blvd
Suite B Up #6
Tiburon, CA 94920
(415) 702-1622
Legal & Privacy
Web Accessibility Policy
Form Client Relationship Summary ("Form CRS") is a brief summary of the brokerage and advisor services we offer.
HTA Client Relationship Summary
HTS Client Relationship Summary
Hightower Advisors, LLC is a SEC registered investment adviser. Registration as an investment adviser does not imply a certain level of skill or training. Some investment professionals may also be registered with Hightower Securities, LLC and offer securities through Hightower Securities, LLC, member FINRA/SIPC. You can check the background of our firm and investment professionals on brokercheck.finra.org. Unless otherwise indicated relative to a specific award or ranking, Hightower Advisors, LLC does not pay a fee to be considered for any ranking or recognition, but may have paid to publicize rankings obtained and disseminated prior to 11.4.2022. All awards / rankings / ratings obtained and distributed on or after 11.4.2022 will be accompanied by specific disclosure as applicable.
© 2025 Hightower Advisors. All Rights Reserved.